Understanding MACD Basics
The MACD (Moving Average Convergence Divergence) is one of the most popular momentum indicators in technical analysis. Traders use it to understand trend direction, strength, and potential turning points in the market. MACD basics are an absolute necessity for any trader or invester to understand .
At its core, MACD helps answer a simple question , Is momentum increasing or decreasing?
Unlike moving averages alone, MACD combines multiple moving averages into one indicator that can highlight shifts in momentum more clearly.
What Is MACD ?
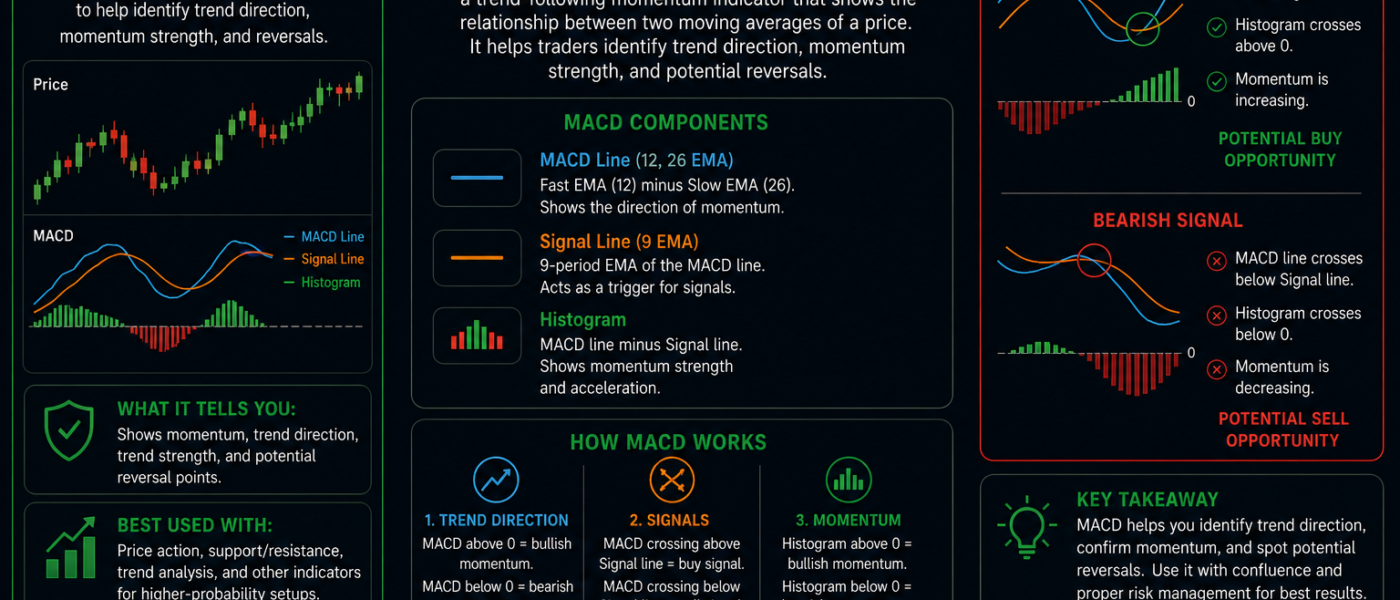
MACD is built using three main components:
- MACD Line
- Signal Line
- Histogram
It is based on the relationship between two exponential moving averages (EMAs), usually:
- 12-period EMA (fast)
- 26-period EMA (slow)
The difference between these two forms the MACD Line.
A 9-period EMA of the MACD Line is then used as the Signal Line.
The MACD Line and Signal Line
MACD Line
The MACD Line shows the difference between short-term and long-term momentum.
- When it rises → bullish momentum increasing
- When it falls → bearish momentum increasing
Signal Line
The Signal Line smooths the MACD Line to help identify changes in direction. Think of it as a trigger line that helps generate trade signals.
What Is a MACD Crossover?
A crossover happens when the MACD Line crosses the Signal Line. This is the most important concept in MACD analysis.
Bullish Crossover
- MACD Line crosses above Signal Line
- Suggests momentum is shifting upward
- Often seen as a potential buy signal
Bearish Crossover
- MACD Line crosses below Signal Line
- Suggests momentum is shifting downward
- Often seen as a potential sell signal
These crossovers help traders spot early momentum shifts before they fully develop in price.
Understanding the Histogram
The MACD Histogram shows the distance between the MACD Line and the Signal Line.
- Increasing bars → momentum strengthening
- Decreasing bars → momentum weakening
Key interpretation:
- Positive histogram → bullish momentum
- Negative histogram → bearish momentum
- Shrinking bars → momentum slowing
The histogram is useful for spotting early signs of reversal, even before a crossover happens.
Why MACD Works
MACD works because it tracks momentum changes over time, not just price direction.
Markets often move in cycles:
- Expansion (strong trend)
- Exhaustion (momentum slows)
- Reversal (new trend begins)
MACD helps identify when a market is transitioning between these phases.
MACD in an Uptrend
In a strong uptrend:
- MACD Line stays above Signal Line
- Histogram remains positive
- Pullbacks are shallow
During healthy trends:
- Crossovers may appear briefly during pullbacks
- But bullish momentum resumes quickly
This shows sustained buyer control.
MACD in a Downtrend
In a strong downtrend:
- MACD Line stays below Signal Line
- Histogram remains negative
- Rallies are weak
Bearish crossovers during downtrends often confirm continuation rather than reversal. MACD Divergence is one of the most powerful MACD signals , where price and momentum disagree.
Bullish Divergence:
- Price makes lower lows
- MACD makes higher lows
→ selling momentum weakening
Bearish Divergence:
- Price makes higher highs
- MACD makes lower highs
→ buying momentum weakening
This often signals that a trend is losing strength before price reacts.
Best Use of MACD Crossovers
MACD crossovers work best when combined with:
- Trend direction
- Support and resistance
- Volume confirmation
- Candlestick patterns
- Higher timeframe analysis
For example:
- Price breaks resistance
- MACD bullish crossover occurs
- Volume increases
→ stronger breakout signal
Common MACD Mistakes
1. Using crossovers in sideways markets
MACD gives many false signals in ranging conditions.
2. Ignoring trend direction
Bullish crossovers in a strong downtrend are often weak signals.
3. Acting without confirmation
Traders should not rely on MACD alone for entries.
MACD vs Moving Averages
While both use moving averages, they serve different purposes:
- Moving averages → show trend direction
- MACD → shows momentum shifts
Understanding Momentum Crossovers
MACD is more sensitive to changes in momentum, making it useful for timing entries and exits.
Simple Way to Read MACD
You can simplify MACD into four key ideas:
- MACD above Signal → bullish momentum
- MACD below Signal → bearish momentum
- Histogram growing → momentum strengthening
- Histogram shrinking → momentum weakening
The MACD indicator is a powerful tool for understanding momentum and identifying potential trend changes. Its strength lies in showing when momentum is accelerating or slowing, helping traders anticipate shifts before they fully appear in price.
While MACD crossovers are useful signals, they are most effective when combined with trend analysis, support and resistance and volume confirmation. Used correctly, MACD Basics can help traders to avoid weak setups, spot early momentum shifts and stay inline with the strong side of the market.