Understanding The Marubozu Candlestick
The Marubozu candlestick pattern is one of the clearest signals of strength or weakness in technical analysis. Traders use it to identify moments when buyers or sellers are completely in control of the market. Unlike many complex chart formations that require several candles to confirm, the Marubozu can provide insight with just a single candlestick.
The word “Marubozu” comes from Japanese candlestick charting and roughly translates to “bald” or “shaven head,” referring to a candle with little or no wick on either side. This clean appearance shows that price moved strongly in one direction throughout the trading session.
What Is a Marubozu Candlestick?
A Marubozu candle has a long body and very small or non-existent upper and lower shadows (wicks). It represents powerful momentum because the price opened near one end of the candle and closed near the opposite end with very little hesitation.
There are two main types:
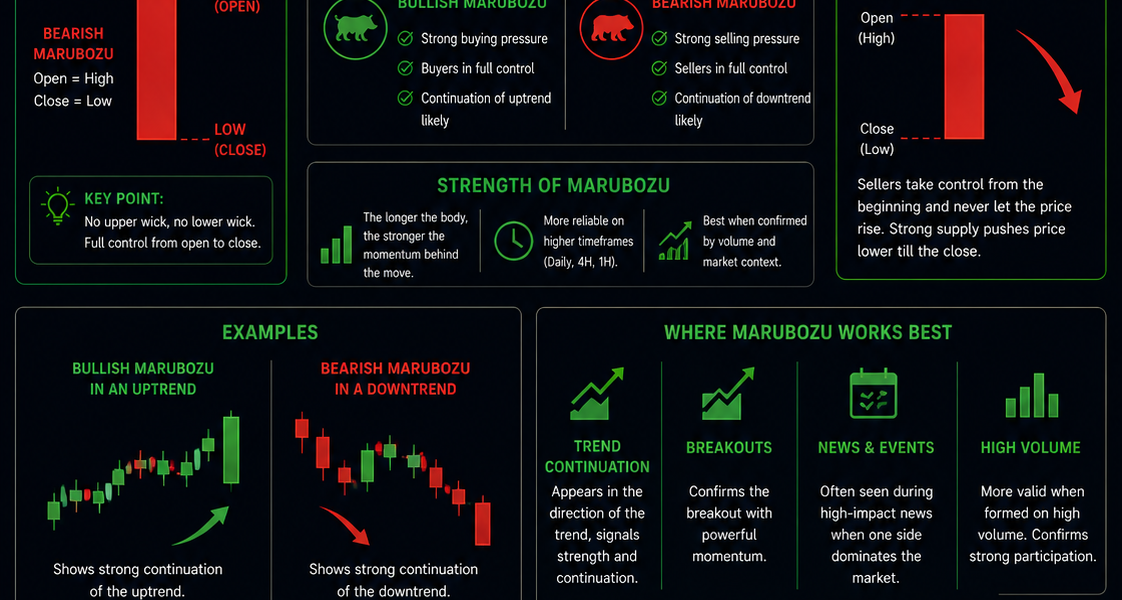
Bullish Marubozu
A bullish Marubozu forms when buyers dominate the session.
- The candle opens near the low
- Price rises consistently
- The candle closes near the high
- Usually displayed as green or white on charts
This pattern signals strong buying pressure and often appears during the start of an uptrend or after a breakout above resistance.
Bearish Marubozu
A bearish Marubozu appears when sellers are fully in control.
- The candle opens near the high
- Price falls throughout the session
- The candle closes near the low
- Usually displayed as red or black
This shows aggressive selling pressure and may signal the start of a downtrend or a continuation of bearish momentum.
Why the Marubozu Pattern Matters
The Marubozu is important because it reflects conviction in the market. Many candlestick patterns show uncertainty through long wicks and small bodies, but the Marubozu shows almost no indecision.
When traders see a strong bullish Marubozu, it suggests buyers were willing to pay increasingly higher prices without significant pullbacks. A bearish Marubozu shows the opposite — sellers pushed prices lower consistently without allowing buyers to regain control.
This makes the pattern useful for:
- Spotting trend continuation
- Identifying breakout strength
- Confirming momentum
- Finding possible reversal points
- Measuring market sentiment
How Traders Use the Marubozu
The Marubozu works best when combined with trend analysis, support and resistance levels, volume, and indicators such as RSI or MACD.
In an Uptrend
A bullish Marubozu during an existing uptrend often confirms continued strength. Traders may use it as a signal to stay in trades or enter after a breakout.
For example, if price breaks above a resistance zone with a large bullish Marubozu candle, it suggests genuine buying pressure rather than a false breakout.
In a Downtrend
A bearish Marubozu during a decline can confirm continued selling momentum. It may encourage traders to hold short positions or avoid entering long trades too early.
After Consolidation
One of the most powerful uses of the Marubozu candlestick is after periods of sideways movement. Markets often build pressure during consolidation before making a decisive move. A large Marubozu candle breaking out of a range can indicate the beginning of a strong trend.
Volume and Confirmation
Volume plays an important role when trading the Marubozu pattern. A strong candle combined with high trading volume gives the signal more credibility.
For example:
- A bullish Marubozu with high volume suggests institutional buying or strong market participation.
- A bearish Marubozu with heavy volume may indicate panic selling or aggressive distribution.
Low-volume Marubozu candles can still work, but they may be less reliable because fewer participants are supporting the move.
Common Trading Strategies
Breakout Trading
Many traders enter trades when price breaks key support or resistance levels with a Marubozu candle.
- Bullish breakout above resistance = potential buy signal
- Bearish breakdown below support = potential sell signal
Traders often place stop losses below the candle low in bullish setups or above the candle high in bearish setups.
Trend Continuation
In strong trends, traders may wait for pullbacks and then use a Marubozu candle as confirmation that momentum is returning in the direction of the trend.
Reversal Signals
Although the Marubozu is usually considered a momentum candle, it can also appear at major turning points.
A bullish Marubozu after a prolonged sell-off may signal buyers are stepping back into the market. Likewise, a bearish Marubozu near the top of a strong rally can warn that sellers are gaining control.
Limitations of the Pattern
Like all technical indicators, the Marubozu is not perfect. Strong candles can sometimes trap traders, especially during volatile news events or low-liquidity conditions.
Some important limitations include:
- False breakouts can occur
- Market context matters
- One candle alone should not determine a trade
- Smaller timeframes may produce unreliable signals
This is why experienced traders combine the Marubozu with additional confirmation tools instead of relying on it in isolation.
The Marubozu candlestick pattern is a powerful visual representation of market dominance. Whether bullish or bearish, it shows that one side controlled the trading session from open to close with very little resistance.
Its simplicity makes it popular among beginner and advanced traders alike. By combining the Marubozu with trend analysis, support and resistance zones, volume, and momentum indicators, traders can improve their understanding of market strength and potential trading opportunities.
While no candlestick pattern guarantees success, the Marubozu candlestick remains one of the clearest signs of strong momentum in technical analysis and is a valuable addition to any trader’s toolkit.