Understanding Volume
Why Price Moves Need Volume to Be “Real”
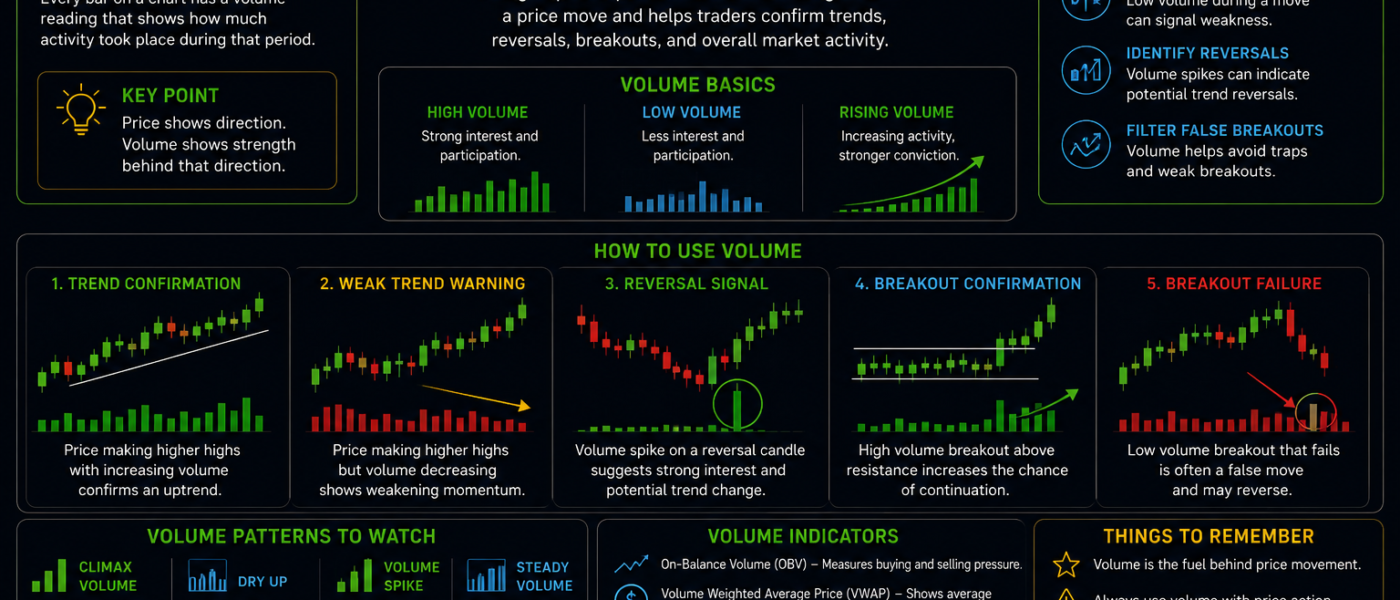
When traders look at charts, most beginners focus only on price movement. However, experienced traders know that volume is one of the most important indicators in technical analysis. A price move without strong volume can often be weak, unreliable, or short-lived. This is why traders frequently say that volume confirms price action. Understanding how volume works can help traders identify stronger trends, avoid false breakouts, and better understand market sentiment.
What Is Volume?
Volume refers to the amount of an asset being traded during a specific time period. In simple terms, volume measures how active the market is.
For example:
- If 10 million shares of a stock are traded in one day, that is the daily volume.
- In cryptocurrency, volume shows how many coins or tokens were bought and sold over a period of time.
Volume is usually displayed as vertical bars underneath the main price chart.
Higher bars mean more trading activity.
Lower bars mean less trading activity.
Why Volume Matters
Volume is important because it shows the strength behind a price movement. Price can move up or down very quickly, but without strong volume, the move may not be reliable. Think of volume as fuel for the market.
A car can roll downhill slowly without much fuel, but to drive powerfully and maintain speed, it needs energy. Markets work in a similar way. Strong price moves backed by high volume are generally considered more meaningful because more traders are participating in the move.
Volume During Uptrends
In a healthy uptrend, traders often look for:
- Rising prices
- Increasing volume
This suggests strong buyer interest and confidence in the move.
For example:
- Bitcoin breaks above resistance
- Trading volume increases sharply
- Price continues climbing
This combination may indicate that the breakout is genuine. If price rises while volume remains weak or declines, the move may lack conviction.
This can sometimes signal:
- Buyer exhaustion
- Weak momentum
- Potential reversal
Volume During Downtrends
Volume also plays an important role during falling markets.
A strong downward move with high volume may indicate:
- Panic selling
- Strong bearish sentiment
- Institutional participation
On the other hand, a price drop on very low volume may simply reflect temporary weakness rather than aggressive selling pressure. Traders often compare current volume with previous trading sessions to judge how significant a move really is.
Volume and Breakouts
One of the most common uses of volume is confirming breakouts.
Strong Breakout
A breakout above resistance with high volume is often considered more reliable because many traders are supporting the move.
Weak Breakout
A breakout with low volume may fail quickly because there is not enough market participation to sustain the move. This is why traders often wait for volume confirmation before entering breakout trades.
For example:
- Ethereum breaks above a major resistance level
- Volume spikes well above average
- Buyers continue pushing price higher
This usually carries more weight than a breakout occurring with weak volume.
Volume Spikes
A sudden increase in volume is known as a volume spike.
Volume spikes can signal:
- Major news events
- Market reversals
- Breakouts
- Panic buying or selling
Large volume spikes often appear at important turning points in the market.
For example, after a long downtrend:
- Price suddenly reverses upward
- Volume surges dramatically
This may indicate that buyers are stepping back into the market aggressively.
Divergence Between Price and Volume
Sometimes price and volume move in opposite directions.
For example:
- Price continues rising
- Volume steadily decreases
This is called divergence and can suggest that the trend is weakening.
Similarly:
- Price falls lower
- Selling volume decreases
This may indicate that sellers are losing momentum. Divergence does not guarantee a reversal, but it can act as an early warning sign.
Accumulation and Distribution
Volume can also help traders identify accumulation and distribution phases.
Accumulation
This occurs when large buyers quietly build positions over time, often before a major upward move.
Signs may include:
- Stable prices
- Gradually increasing volume
- Repeated buying support
Distribution
This happens when large holders begin selling positions before a potential decline.
Signs may include:
- Price struggling to move higher
- Increased selling volume
- Repeated rejection near resistance
Understanding these phases can help traders identify possible market turning points.
Combining Volume With Other Indicators
Volume becomes more powerful when combined with:
- Support and resistance
- Trendlines
- Moving averages
- Candlestick patterns
- RSI indicators
For example:
- A breakout above resistance
- Strong bullish candle
- High trading volume
These signals may provide stronger confirmation than using any single indicator alone. Volume is one of the most valuable tools in technical analysis because it reveals the strength behind market moves.
Price movements backed by strong volume are generally considered more trustworthy, while weak volume can signal uncertainty or lack of conviction. By learning how volume interacts with trends, breakouts, and reversals, traders can gain a clearer understanding of market psychology and avoid many common trading mistakes.
Although volume alone should never be used as a guaranteed signal, combining it with other technical analysis tools can help traders make more informed decisions in fast-moving markets.