Beginners Guide to Trend Lines and Channels
How to Draw Trend Lines Like a Pro
Trend lines are one of the simplest yet most effective tools available to traders. Whether you’re trading cryptocurrency, stocks, forex, or commodities, understanding how to draw trend lines correctly can help you identify market direction, spot potential entry points, and improve your overall trading decisions.
The mistake many beginners make is drawing trend lines only after a move has already happened. Professional traders learn how to draw trend lines as they develop in real time, allowing them to react to market movements rather than simply observing them after the fact.
What Is a Trend Line?
A trend line is a straight line drawn on a chart that connects a series of price highs or lows. Its purpose is to show the overall direction of the market.
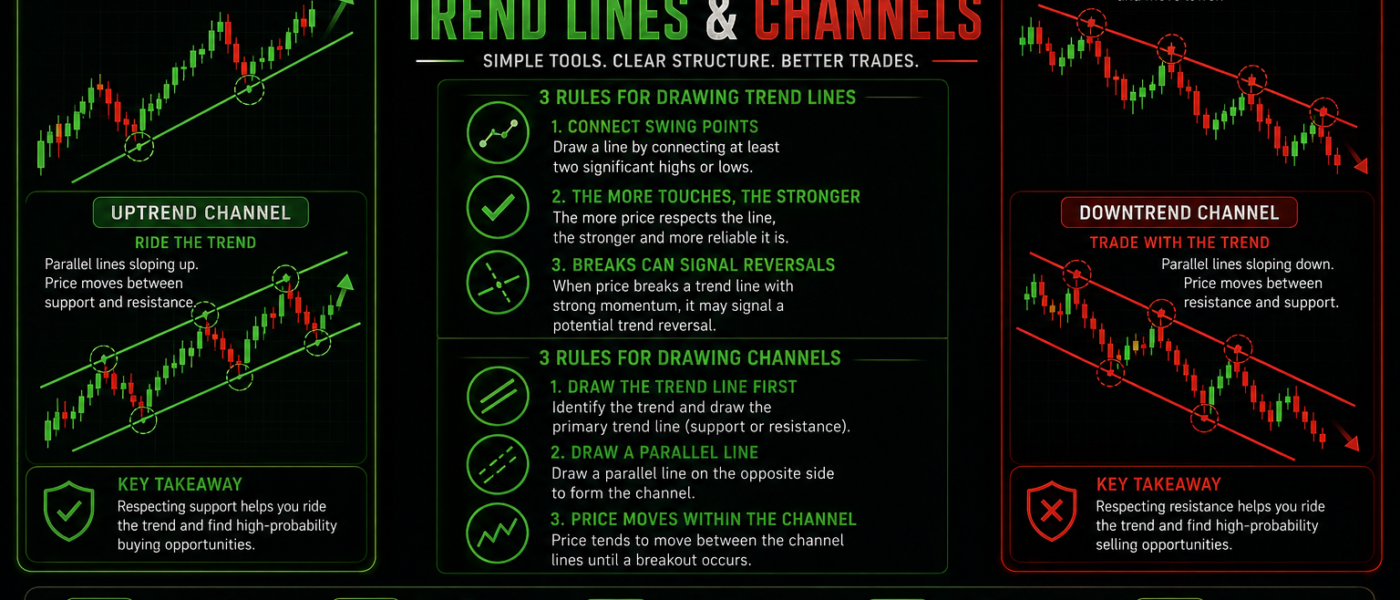
In an uptrend, trend lines are drawn beneath price, connecting higher lows.
In a downtrend, trend lines are drawn above price, connecting lower highs.
The more times price respects a trend line, the more significant that line becomes. Think of a trend line as a visual representation of support and resistance that evolves with the market.
Drawing an Uptrend Line
To draw an uptrend line correctly:
- Identify two significant swing lows.
- Draw a line connecting those lows.
- Extend the line into the future.
A common mistake is forcing the line to fit every candle. Trend lines are meant to capture the overall structure of the move, not every small fluctuation. The most important requirement is that the second low is higher than the first. This confirms that buyers are stepping in at increasingly higher prices. Once the trend line is drawn, traders watch for future pullbacks. If price returns to the line and bounces, it can provide confirmation that the uptrend remains intact.
Drawing a Downtrend Line
The process is reversed for a downtrend.
- Locate two significant swing highs.
- Connect the highs with a straight line.
- Extend the line forward.
As long as price continues creating lower highs and respecting the trend line, sellers remain in control. When price eventually breaks above a well-established downtrend line, it may signal weakening bearish momentum and the possibility of a trend reversal.
How to Draw Trend Lines as They Develop
One of the biggest challenges for new traders is learning to draw trend lines before the market has fully revealed its direction. The key is understanding that you only need two points to create a potential trend line. For example, imagine Bitcoin creates a swing low at $100,000 and then rallies. After pulling back, it forms another higher low at $105,000.
At this point, you can draw a developing trend line connecting those two lows. You don’t need a third touch to draw it. The third touch is often what confirms the trend line’s importance. This approach allows traders to prepare for future opportunities rather than reacting after a move has already happened. A developing trend line should be treated as a working theory. As new candles form, the market either validates or invalidates that theory.
Understanding Trend Line Breaks
Many traders assume that a trend line break automatically means the trend has ended. Unfortunately, it’s not always that simple. Markets frequently produce false breakouts where price briefly moves beyond the trend line before returning to the original trend. This is why experienced traders often wait for confirmation before acting.
Confirmation may include:
- A candle closing beyond the trend line.
- Increased trading volume.
- A retest of the broken trend line.
- A change in market structure.
Using multiple forms of confirmation can help reduce false signals.
What Are Channel Trend Lines?
Once you’ve mastered basic trend lines, the next step is learning channel trend lines. A channel occurs when price moves between two parallel trend lines.
The lower line acts as support.
The upper line acts as resistance.
Channels help traders estimate where future price reactions may occur and provide a framework for identifying potential profit targets.
How to Draw an Ascending Channel
An ascending channel forms during an uptrend. Start by drawing your primary uptrend line beneath price. Next, create a parallel line above price that connects the swing highs. You should now have a channel containing most of the price action. As price moves within the channel, traders often look for:
- Buying opportunities near channel support.
- Profit-taking opportunities near channel resistance.
- Breakouts beyond the channel boundaries.
The longer a channel remains intact, the more significant it becomes.
How to Draw a Descending Channel
Descending channels work the same way but occur during downtrends. Draw the main trend line across lower highs. Then place a parallel line beneath price connecting lower lows. This creates a downward-sloping trading range. Traders frequently watch for bounces between the channel boundaries while remaining aware of any potential breakout opportunities.
Best Practices for Trend Line Trading
To improve your trend line analysis:
- Use higher timeframes first before zooming into smaller charts.
- Focus on obvious swing points rather than minor price fluctuations.
- Avoid forcing trend lines to fit your market bias.
- Combine trend lines with volume, support and resistance, or moving averages.
- Remember that trend lines are guides, not guarantees.
The best trend lines are usually the ones that are immediately obvious when looking at a chart.
Trend lines remain one of the most powerful tools in technical analysis because they help traders simplify complex price action into clear visual structures. Learning to draw trend lines as they develop allows you to anticipate potential opportunities before they become obvious to everyone else.
When combined with channel trend lines, traders can gain an even clearer picture of the markets direction, potential support and resistance areas, and possible breakout zones. Like any trading tool, trend lines are most effective when used alongside sound risk management and confirmation from other technical indicators. Master the basics, practice regularly, and you’ll soon find that trend lines become one of the first tools you use when analysing any channels .