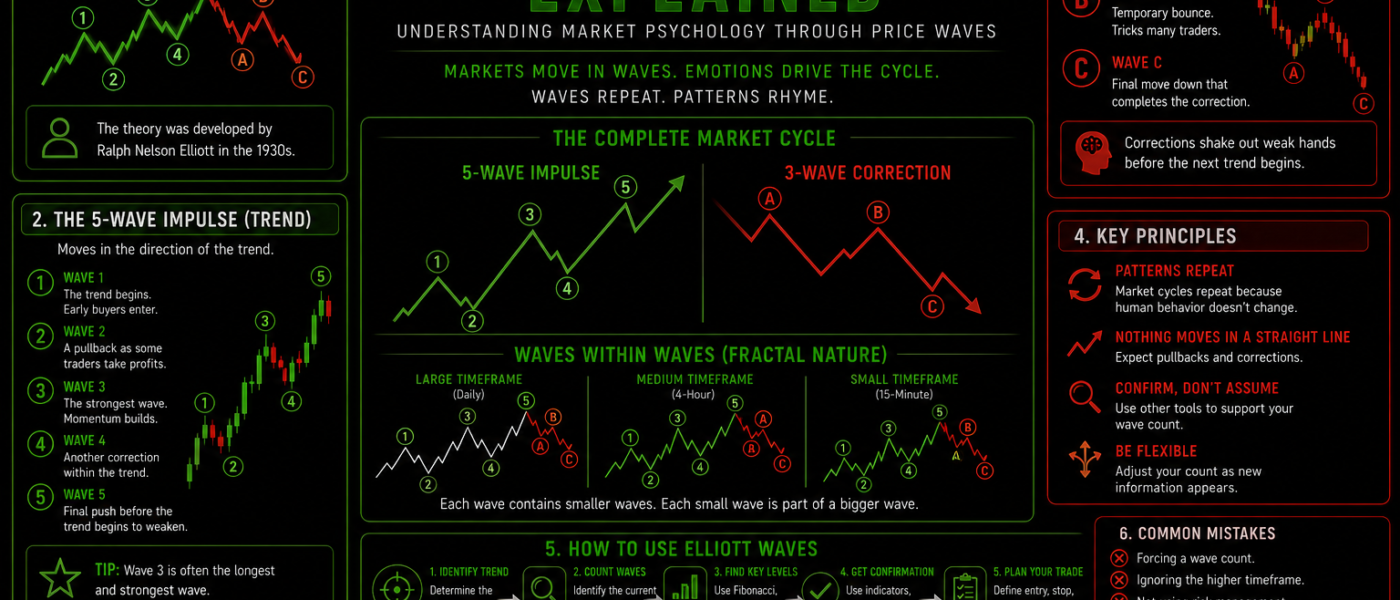
Elliott Wave Theory Explained:
Understanding Market Psychology Through Price Waves
Financial markets often appear chaotic, with prices rising and falling for no obvious reason. However, one of the most influential theories in technical analysis suggests that market movements are far from random. Elliott Wave Theory proposes that price action follows repeating wave patterns driven by human psychology.
Whether you’re trading cryptocurrencies, stocks, or forex, understanding Elliott Wave Theory can help you recognise where a market may be within its larger trend and prepare for potential opportunities.
What Is Elliott Wave Theory?
Elliott Wave Theory was developed by American accountant Ralph Nelson Elliott during the 1930s. After studying decades of stock market charts, Elliott noticed that markets seemed to move in recurring patterns rather than completely unpredictable swings.
His theory is based on one simple idea: Markets move in repetitive waves because investor emotions repeat over time. Fear, greed, optimism, panic, and confidence have always influenced financial markets, and because human behaviour remains relatively consistent, these emotional cycles often create recognisable price structures.
The Five-Wave Impulse Pattern
The foundation of Elliott Wave Theory is the five-wave impulse.
During a strong trend, prices generally move in five distinct waves.
- Wave 1: The trend begins as early buyers enter the market.
- Wave 2: A pullback occurs as some traders take profits.
- Wave 3: Often the strongest and longest wave as more traders recognise the trend.
- Wave 4: Another correction develops while the overall trend remains intact.
- Wave 5: The final push higher before the larger trend begins to weaken.
Many traders pay particular attention to Wave 3 because it often contains the strongest momentum and highest trading volume.
The Three-Wave Correction
Once the five-wave trend is complete, the market typically enters a corrective phase consisting of three waves known as A, B, and C.
- Wave A: The initial decline against the previous trend.
- Wave B: A temporary recovery that convinces some traders the original trend is continuing.
- Wave C: The final corrective move that often completes the retracement.
Together, the five-wave advance and three-wave correction form a complete market cycle.
Markets Move in Fractals
One of the most fascinating aspects of Elliott Wave Theory is its fractal nature. Each wave can be broken down into smaller waves, while also forming part of a much larger wave.
For example:
- A five-minute chart may contain a complete Elliott Wave cycle.
- That same cycle could simply represent one small wave on a four-hour chart.
- The four-hour chart itself may be part of an even larger weekly trend.
This nesting of waves allows traders to analyse markets across multiple timeframes.
Why Psychology Matters
Unlike many technical indicators that rely purely on mathematical calculations, Elliott Wave Theory focuses heavily on market sentiment. Every wave reflects changing emotions among participants. Early in a trend, only a small number of traders believe prices will move higher. As confidence grows, more buyers join the move, creating stronger momentum.
Eventually optimism becomes excessive, buying pressure begins to fade, and the market becomes vulnerable to a correction. Understanding this psychological cycle can help traders appreciate why trends rarely move in straight lines.
Combining Elliott Waves With Other Indicators
Although Elliott Wave Theory can be powerful, many experienced traders avoid using it in isolation. Instead, they combine it with other technical analysis tools such as:
- Fibonacci Retracement levels
- Support and resistance zones
- Trend lines
- Moving averages
- RSI (Relative Strength Index)
- MACD
- Volume analysis
For example, if a potential Wave 2 correction reaches a major Fibonacci retracement level while RSI shows oversold conditions, traders may view this as additional evidence supporting a possible continuation of the trend. Using multiple forms of confirmation often produces more reliable trading decisions than relying on a single method.
Common Challenges
One criticism of Elliott Wave Theory is that wave counting can be subjective. Two experienced analysts may examine the same chart and produce different wave counts. This is because markets do not always form perfectly structured waves. Unexpected news events, economic announcements, and sudden shifts in sentiment can temporarily disrupt price patterns. For this reason, successful traders often remain flexible rather than forcing charts to fit a preferred wave count.
Risk Management Remains Essential
No technical analysis method predicts markets with complete accuracy. Elliott Wave Theory offers a framework for understanding price structure, but every trade still carries risk.
Using stop-loss orders, sensible position sizing, and disciplined risk management helps protect trading capital when markets behave differently than expected. Even highly experienced Elliott Wave analysts regularly adjust their market outlook as new price data becomes available.
Is Elliott Wave Theory Worth Learning?
For traders interested in understanding market structure and investor psychology, Elliott Wave Theory remains one of the most respected approaches in technical analysis. While it has a learning curve and requires practice, it encourages traders to view price action as part of a larger story rather than focusing on individual candles alone.
Like any trading strategy, Elliott Wave Theory works best when combined with sound risk management and additional technical confirmation. With time, patience, and consistent chart study, traders can begin recognising recurring wave structures and develop a deeper understanding of how markets often progress through cycles of optimism, correction, and renewal.
Elliott wave theory explained properly won’t eliminate uncertainty, but it can provide a valuable framework for analysing trends and understanding the emotional forces that drive financial markets.
