Mastering the Markets with Heikin Ashi Charts
Most traders begin their journey using traditional Japanese candlestick charts. While these charts are excellent for showing price action, they can sometimes appear noisy, especially during volatile market conditions. Constant changes in candle colour can make it difficult to identify the true direction of a trend.
This is where Heikin Ashi charts can become a valuable addition to your trading toolkit.
Rather than displaying every fluctuation in price, Heikin Ashi charts smooth out market movement, making trends easier to recognise. They are not designed to replace standard candlesticks but instead offer a different perspective that helps traders focus on the bigger picture.
What Are Heikin Ashi Charts?
“Heikin Ashi” is a Japanese term meaning average bar. Unlike traditional candlestick charts, each Heikin Ashi candle is calculated using information from both the current and previous candles. This smoothing effect filters out much of the short-term market noise while still reflecting the overall direction of price movement.
Although the chart may look similar to a standard candlestick chart, the candles are created using a modified formula rather than actual open, high, low and close prices. Because of this, traders should remember that Heikin Ashi candles do not show the exact market price at every point. Instead, they provide a simplified view of market momentum.
Why Traders Use Heikin Ashi
The main advantage of Heikin Ashi charts is their ability to make trends easier to identify. Traditional candlestick charts often switch between bullish and bearish candles during normal market fluctuations. This can lead traders to exit positions too early or mistake a temporary pullback for a complete trend reversal.
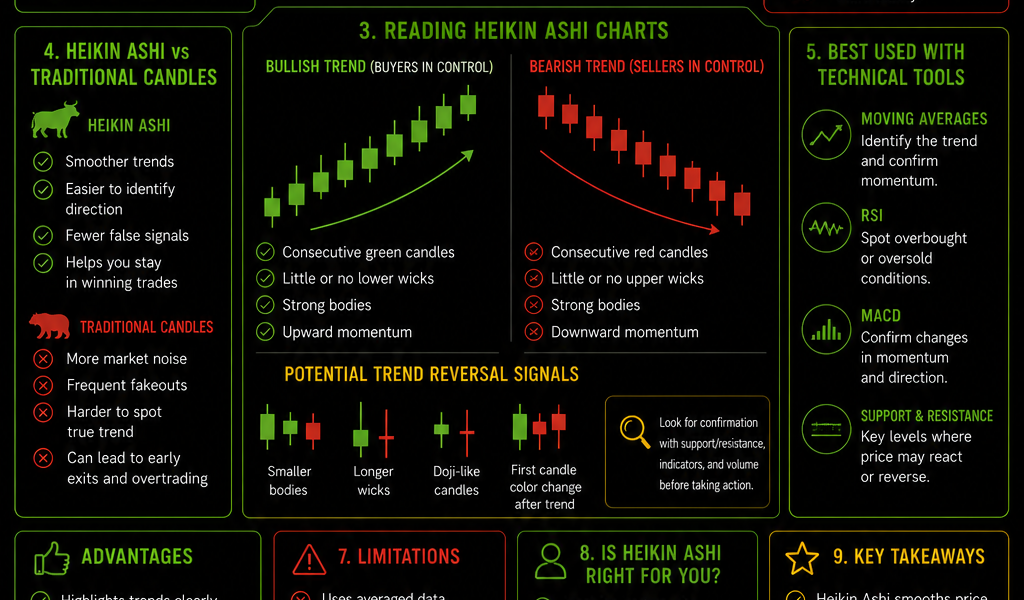
Heikin Ashi reduces this confusion by producing smoother price action. When a strong uptrend develops, consecutive bullish candles often appear with very small or no lower shadows. During strong downtrends, bearish candles frequently form with little or no upper shadow. These visual clues allow traders to stay with the trend for longer rather than reacting to every minor price movement.
Identifying Strong Trends
One of the biggest strengths of Heikin Ashi charts is trend identification.
A healthy bullish trend is often characterised by:
- A series of consecutive green (or bullish) candles
- Little or no lower wicks
- Relatively large candle bodies
- Consistent upward movement
Strong bearish trends usually display:
- Consecutive red (or bearish) candles
- Small or non-existent upper wicks
- Large candle bodies
- Steady downward movement
Rather than concentrating on every individual candle, traders can focus on the overall flow of the market.
Spotting Potential Trend Reversals
No trend lasts forever. Eventually buyers become exhausted or sellers begin taking profits, causing momentum to weaken. On Heikin Ashi charts, this often becomes visible before a full trend reversal develops.
Possible warning signs include:
- Smaller candle bodies
- Longer upper and lower shadows
- Doji-style candles
- The first candle changing colour after a prolonged trend
These signals should not automatically trigger a trade. Instead, they indicate that traders may wish to monitor the market more closely for additional confirmation. Many experienced traders combine Heikin Ashi with support and resistance levels, volume analysis or momentum indicators before making trading decisions.
Combining Heikin Ashi with Technical Indicators
Although Heikin Ashi works well on its own, many traders use it alongside other technical analysis tools. Popular combinations include:
Moving Averages
Moving averages help identify the longer-term trend while Heikin Ashi provides confirmation of short-term momentum.
Relative Strength Index (RSI)
The RSI can help identify overbought and oversold conditions, particularly when Heikin Ashi begins showing signs of slowing momentum.
MACD
The Moving Average Convergence Divergence indicator is often used to confirm changes in market momentum that become visible on Heikin Ashi charts.
Support and Resistance
Even with smooth price action, major support and resistance zones remain important. These areas often act as decision points where trends pause or reverse.
Advantages of Heikin Ashi Charts
There are several reasons why traders continue to use Heikin Ashi across different markets. The smoother appearance makes trends easier to recognise while reducing the emotional impact of short-term price fluctuations. Many traders also find it easier to remain in profitable trades because the chart produces fewer false reversal signals compared with traditional candlesticks.
Heikin Ashi charts can also improve discipline by encouraging traders to wait for stronger confirmation before entering or exiting positions. Whether trading stocks, forex, commodities or cryptocurrencies, the underlying principles remain the same.
Limitations to Remember
No charting method is perfect. Because Heikin Ashi uses averaged data, the candles lag behind actual market prices. This means traders may enter slightly later than those using traditional candlestick charts.
Likewise, exits may also occur later after a trend has already started to reverse. Another consideration is that exact opening and closing prices are not shown on each candle. This makes Heikin Ashi less suitable for traders who rely on precise candlestick patterns such as engulfing candles or pin bars.
For this reason, many traders switch between Heikin Ashi and standard candlestick charts depending on the type of analysis they are performing.
Is Heikin Ashi Right for You?
Heikin Ashi is particularly useful for traders who struggle with market noise or frequently exit trades too early. By presenting a cleaner picture of market direction, it becomes easier to focus on trends instead of reacting to every small movement.
However, like every technical analysis tool, it should form part of a broader trading strategy rather than being used in isolation. Successful traders combine chart analysis with sound risk management, position sizing and patience.
Heikin Ashi charts offer a simple yet effective way to analyse market trends with greater clarity. Their ability to smooth price action makes them especially popular among swing traders and trend-following investors who want to stay focused on the broader direction of the market. While they may not replace traditional candlestick charts entirely, they provide another valuable perspective that can improve confidence when analysing price action.
Like any trading tool, success comes through practice. Spend time comparing Heikin Ashi charts with standard candlestick charts across different markets and timeframes. Over time, you’ll develop a better understanding of how these unique candles can support your trading decisions and help you navigate the markets with greater discipline.
