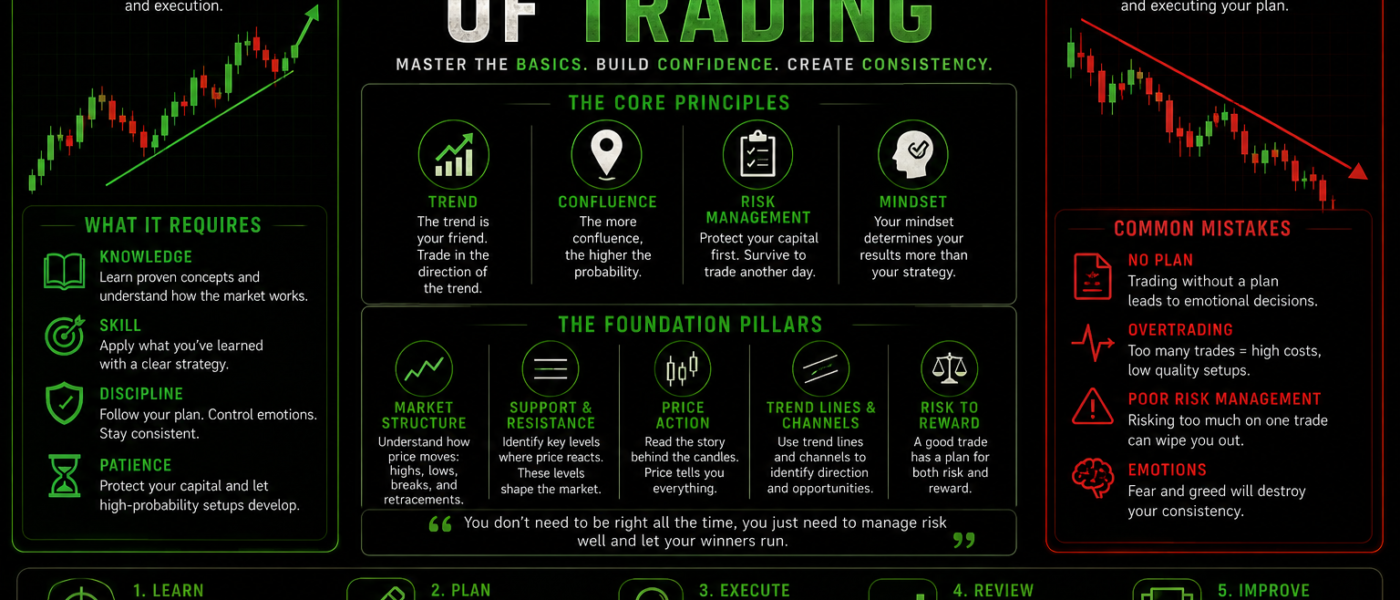
The Foundation of Trading
Before you can begin to master chart patterns, indicators or advanced trading strategies, you must first understand the language of the market: Every candlestick represents a battle between buyers (bulls) and sellers (bears) over a specific period of time. Learning to read that battle is one of the most valuable skills any trader can develop.
Whether you are trading Bitcoin, Ethereum, stocks or foreign exchange, candlestick charts are one of the most widely used methods of analysing price action. They allow traders to quickly see who is in control of the market and how sentiment is changing from one candle to the next.
The Anatomy of a Candle
Each candlestick consists of three main parts:
The Body
The thick middle section of the candle is known as the body. It shows the difference between the opening price and the closing price during the selected time period. A large body usually indicates strong buying or selling pressure, while a small body often suggests uncertainty or a lack of momentum.
The Wick (Shadow)
The thin lines above and below the body are called the wicks, sometimes referred to as shadows. They show the highest and lowest prices reached before the candle closed. Long wicks can reveal that one side briefly took control before the other side fought back.
The Colour
Most trading platforms use colours to make charts easier to read. A green candle generally means the price closed higher than it opened, making it bullish. A red candle means the price closed lower than it opened, making it bearish. Some charting platforms use white and black candles instead, but the principle remains exactly the same.
Every Candle Tells a Story
Many beginners simply see green candles as “good” and red candles as “bad”. Experienced traders look much deeper.
Imagine a green candle with a long upper wick. Buyers managed to push the price significantly higher during that period, but sellers entered the market and forced the price back down before the candle closed. Although the candle finished green, it also tells us that sellers were becoming active.
Likewise, a red candle with a long lower wick shows that sellers initially dominated, but buyers stepped in and recovered much of the decline before the candle closed. This often suggests that buying pressure is beginning to increase.
Understanding these small details helps traders recognise shifts in momentum long before they become obvious.
Why Candles Matter in Crypto
Cryptocurrency markets are known for their volatility. Prices can move dramatically within minutes, making it essential to understand what the market is communicating.
Candlesticks provide valuable clues about momentum, emotion and potential turning points. During strong bull markets, for example, you may notice candles with increasingly long upper wicks. This can suggest that buyers are becoming exhausted and sellers are beginning to take profits.
Similarly, after a prolonged decline, candles with long lower wicks may indicate that buyers are becoming more confident and absorbing selling pressure.
No single candle guarantees what will happen next, but together they help traders build a clearer picture of market sentiment.
Three Common Beginner Candles
When first learning candlestick analysis, it helps to recognise a few important formations.
The Marubozu
A Marubozu has a large body with little or no wick. This shows complete dominance by either buyers or sellers throughout the entire trading period. Bullish Marubozu candles often appear during strong upward momentum, while bearish versions can signal powerful selling pressure.
The Doji
A Doji forms when the opening and closing prices are almost identical. This creates a very small body with upper and lower wicks. A Doji represents indecision, where neither buyers nor sellers managed to gain control. After a strong trend, it can sometimes suggest that momentum is beginning to weaken.
The Hammer
A Hammer pattern has a small body near the top of the candle and a long lower wick. During the trading period, sellers pushed the price sharply lower before buyers regained control and forced the price back towards the opening level. When found after a downtrend, this pattern can sometimes indicate that a reversal may be developing.
Context Is Everything
One of the biggest mistakes new traders make is believing that candlestick patterns work in isolation.
A Hammer appearing in the middle of a sideways market often means very little. The same Hammer appearing directly on a major support level after a prolonged downtrend carries far more significance.
Always consider where the candle appears on the chart. Ask yourself questions such as:
- Has the market been trending upwards or downwards?
- Is price approaching an important support or resistance level?
- Is trading volume increasing or decreasing?
- Are several candles telling the same story?
Professional traders rarely make decisions based on a single candle. Instead, they combine candlestick analysis with market structure and confirmation from other tools.
Timeframes Matter
Every candlestick represents a specific amount of time.
A one-minute chart creates a new candle every minute, while a one-hour chart forms one every hour. Daily charts create one candle every day, and weekly charts create one every week. The same pattern can appear on multiple timeframes, but its significance may differ. Many traders use higher timeframes to identify the overall market direction before looking for trading opportunities on lower timeframes.
Understanding how different timeframes work together can greatly improve your decision-making and help filter out unnecessary market noise.
Building Your Trading Foundation
Learning candlesticks and technical analysis is much like learning the alphabet before reading a book. Without understanding individual candles, it becomes much harder to recognise chart patterns, trend reversals and trading opportunities.
Discover how candlesticks combine with support and resistance, trend lines, volume, moving averages and chart patterns to create a complete picture of market behaviour. Master the foundation of trading first. Every successful trader, regardless of experience, relies on these basic building blocks every time they open a chart.
.
