Understanding Candlestick Basics
Candlestick charts are one of the most popular tools used in technical analysis. Whether you trade cryptocurrencies, forex, stocks, or commodities, learning how to read candlesticks can help you better understand market sentiment and price movement. Originally developed by Japanese rice traders centuries ago, candlestick charts remain a core part of modern trading because they present a large amount of information in a simple visual format.
For beginners,, understanding candle stick basics may look confusing at first, but once you understand the structure behind them, they become much easier to read. Each candle tells a story about the battle between buyers and sellers during a specific period of time.
What Is a Candlestick?
A candlestick represents price movement during a selected time frame. Depending on the chart settings, one candle could represent one minute, one hour, one day, or even one week of trading activity.
Every candlestick contains four important pieces of information:
- Open price
- Close price
- Highest price
- Lowest price
These four values are commonly referred to as OHLC data.
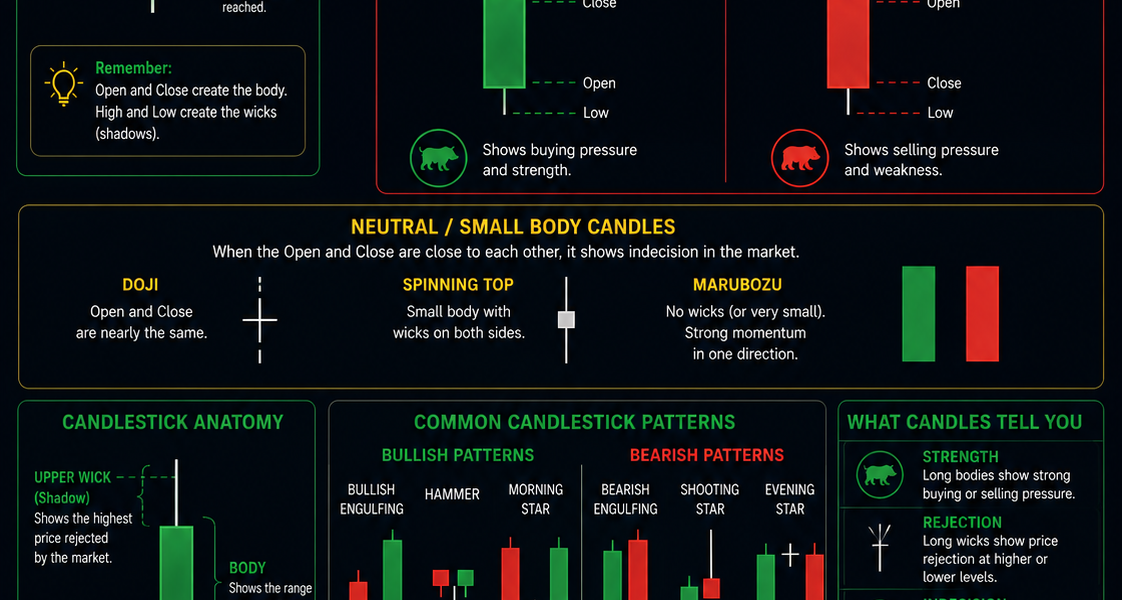
The thick middle section of the candle is called the body, while the thin lines extending above and below are called the wicks or shadows.
If the closing price is higher than the opening price, the candle is usually displayed in green or white. This is known as a bullish candle, showing that buyers were in control during that period. If the closing price is lower than the opening price, the candle is usually red or black. This is known as a bearish candle, showing that sellers dominated.
Understanding Candle Bodies
The size of the candle body can reveal important information about market strength. A long bullish body suggests strong buying pressure. Buyers managed to push the price significantly higher before the candle closed. A long bearish body suggests strong selling pressure. Sellers remained in control throughout the session.
Small candle bodies often indicate indecision in the market. Neither buyers nor sellers gained a clear advantage, which may signal consolidation or a potential reversal. For example, if Bitcoin opens at £80,000 and closes at £82,000 during a four-hour period, the candle body represents the £2,000 increase in price.
Understanding Wicks and Shadows
The wicks show how far the price moved beyond the open and close prices during the selected time frame. A long upper wick suggests that buyers pushed the price higher at one stage, but sellers forced the price back down before the candle closed. This can sometimes indicate weakening bullish momentum.
A long lower wick suggests that sellers drove prices lower, but buyers stepped in and pushed the market back upward. This may signal buying interest or support. Wicks become especially important near support and resistance levels because they can reveal failed breakouts or strong rejection zones.
Bullish vs Bearish Candles
Understanding the difference between bullish and bearish candles is essential for reading market sentiment.
Bullish Candle
A bullish candle forms when:
- The close is above the open
- Buyers control the session
- The candle is often green
Bullish candles can signal upward momentum, especially when several appear consecutively.
Bearish Candle
A bearish candle forms when:
- The close is below the open
- Sellers dominate the session
- The candle is often red
Multiple bearish candles in a row can suggest strong downward momentum.
Traders should avoid relying on single candles alone. Candlestick analysis works best when combined with overall trend direction, volume, support and resistance, and other technical indicators.
Why Candlestick Patterns Matter
Individual candles are useful, but groups of candles can form recognizable patterns that traders use to predict possible market direction.
Some common beginner-friendly patterns include:
These patterns attempt to reveal shifts in market psychology. For example, a hammer candle appearing after a strong downtrend may indicate that sellers are losing strength and buyers are beginning to regain control.
Similarly, a bearish engulfing pattern near resistance may warn that a downward reversal could be approaching. While no pattern guarantees success, understanding these formations helps traders identify potential opportunities and manage risk more effectively.
Choosing the Right Time Frame
Candlestick charts can be used on nearly any timeframe. Day traders may focus on 1-minute or 5-minute charts, while swing traders often prefer 4-hour or daily charts. Lower timeframes produce more market noise and false signals, while higher timeframes generally provide stronger and more reliable setups.
Many experienced traders analyse multiple timeframes together. For example:
- Daily chart for overall trend
- 4-hour chart for setup confirmation
- 1-hour chart for entries
This approach helps create a clearer market picture.
Candlesticks and Market Psychology
One reason candlestick charts remain so powerful is because they reflect human emotion. Every candle represents fear, greed, uncertainty, confidence, or panic within the market.
Large bullish candles can reflect excitement and aggressive buying. Long bearish candles may represent panic selling. Small candles often show hesitation as traders wait for direction. Learning to interpret these emotional shifts can help traders better understand crowd behaviour rather than simply memorising patterns.
Common Beginner Mistakes
Many beginners make the mistake of trading every candlestick pattern they see. In reality, context matters far more than the pattern itself. A bullish signal appearing during a strong downtrend may fail quickly. Likewise, bearish patterns during powerful uptrends can easily be ignored by the market.
Other common mistakes include:
- Ignoring overall trend direction
- Trading without stop-losses
- Using too many indicators
- Focusing only on short timeframes
- Expecting patterns to work perfectly every time
Successful trading requires patience, discipline, and proper risk management.
Understanding candlestick basics is one of the first major steps in learning technical analysis. Candlesticks provide valuable insight into market sentiment, price momentum, and potential reversals in a simple visual format.
By learning how to understanding candlestick basics, wicks, bullish and bearish signals, and basic chart patterns, traders can begin building a stronger understanding of how markets move. Like any trading skill, candlestick analysis improves with practice. The more charts you study, the easier it becomes to recognise patterns, understand market psychology, and identify higher-probability setups